PsiHistrogram Distribution
PsiHistogram (a,b,{w1,w2,…,wn},…)
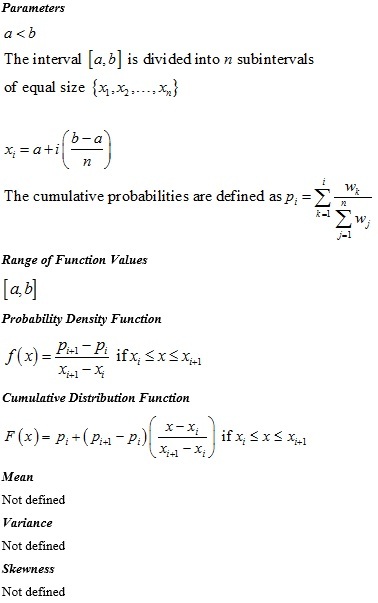
PsiHistogram (a,b,{w1,w2,…,wn},…) is a custom continuous distribution with lower and upper bounds equal to a and b respectively, and with user specified weights w1,w2,…,wn corresponding to n subintervals of equal size. This is similar to a PsiCumul (a,b, {x1,x2,…,xn},{p1,p2,…,pn},…) distribution, where the probabilities are calculated using the weights as shown below, and the interval defined by the bounds a and b is divided into subintervals of equal size as described below.