
Line Chart Example
The example below illustrates the use of Analytic Solver Data Science’s chart wizard in drawing a Line Chart using the Airpass.xlsx dataset. Click Help – Example Models on the Data Science ribbon to open the example dataset, Airpass.xlsx under Forecasting/Data Science Example Models. Select a cell within the dataset, say A2, and then click Explore – Chart Wizard on the Data Science ribbon, then select Line Chart. 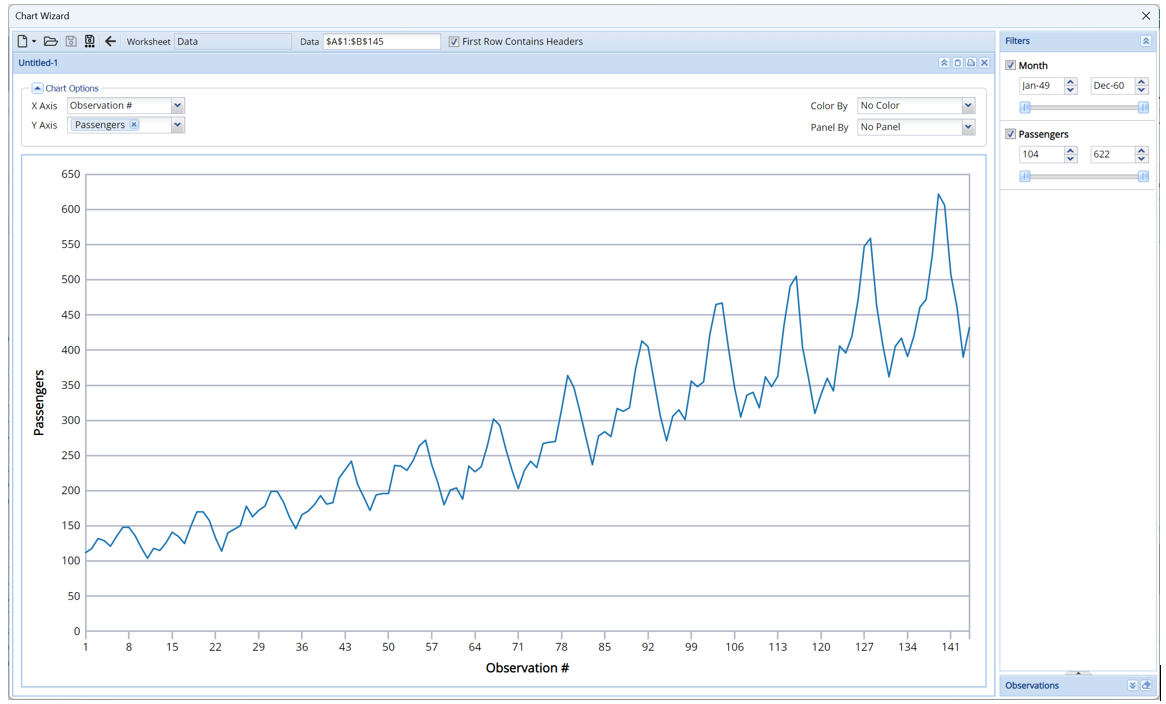
The y-axis plots the number of passengers and the x-axis plots the month. This plot shows that as the months progress, the number of airline passengers appear to be in an increasing trend with yearly seasonality dips.