Scatterplot Matrix Example
The example below illustrates the use of Analytic Solver Data Science’s chart wizard in drawing a Scatterplot Matrix using the Iris.xlsx dataset. Click Help – Example Models on the Data Science ribbon to open the example dataset, Iris.xlsx. Select a cell within the dataset, say A2, then click Explore – Chart Wizard on the Data Science ribbon. Select Scatterplot Matrix.
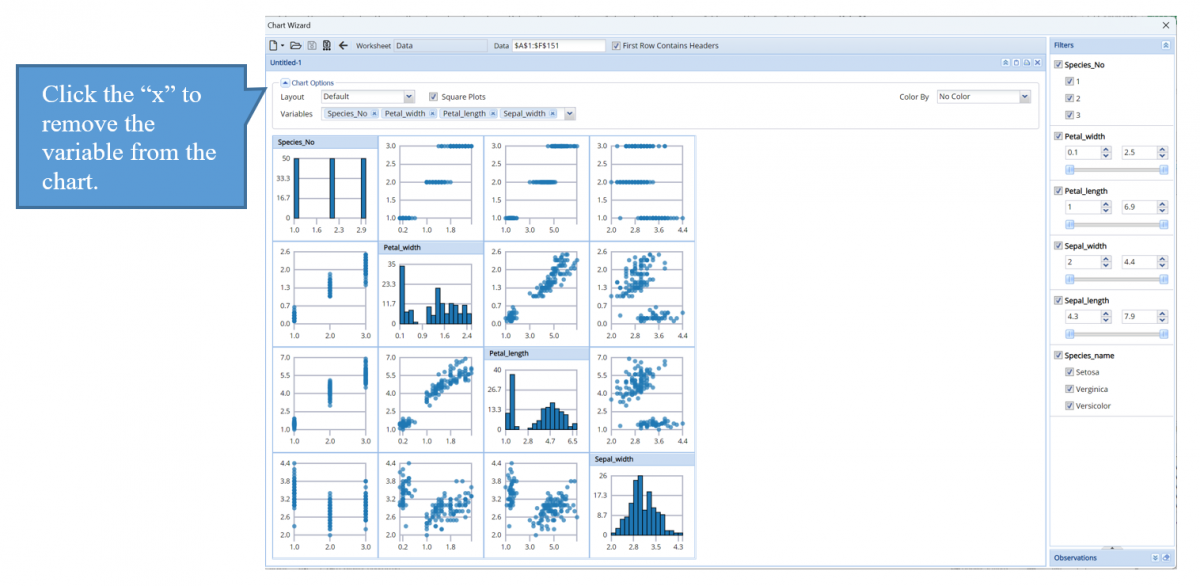
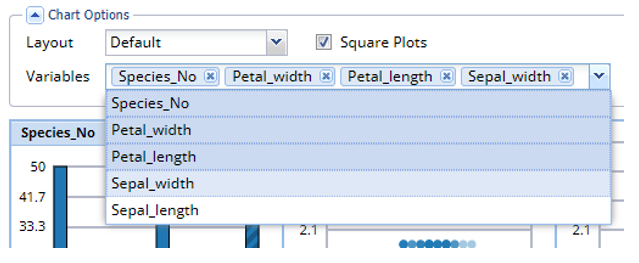
Histograms of all variables appear on the diagonal. To remove a variable from the matrix, next to Variables (top, left), click the “x” next to the variable to be removed. To add a variable to the matrix, click the down arrow and select the desired variable.
Graphs on either side of the diagonal represent a pairwise relationship between all variables. For example, the graph in the 2nd column, 1st row, shows the relationship between Species_no and Petal_width. The Y-axis for either plot can be found on the far left of the chart and the X-axis for either plot can be found at the far bottom.
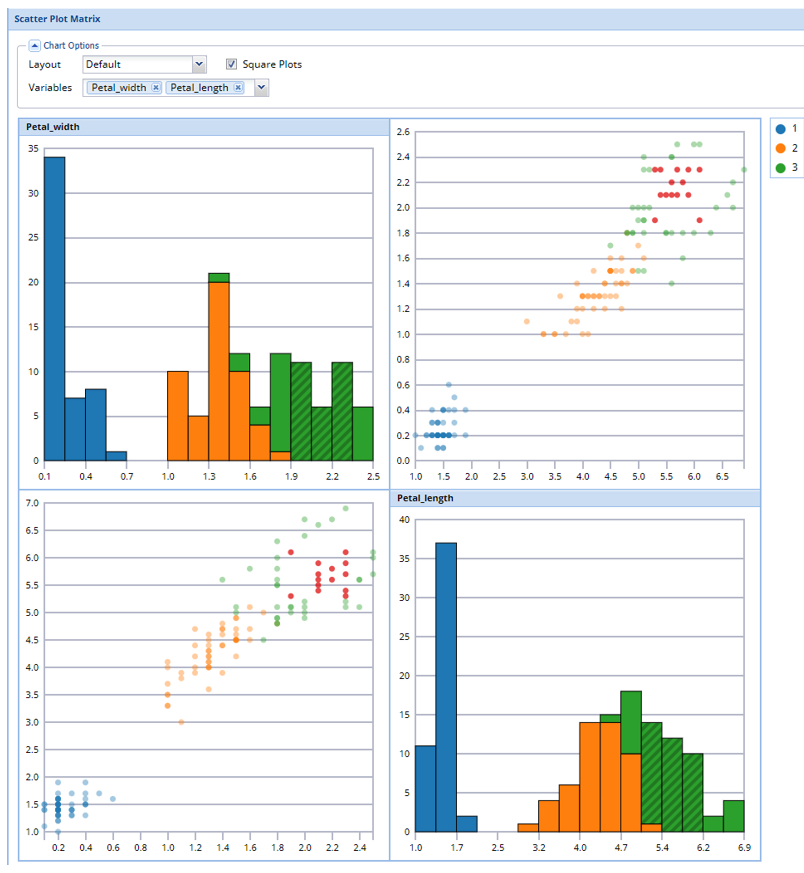
Remove all variables except Petal_width and Petal_length, then use the Color By feature to easily see the petal characterisitics of each species of iris.